Fuzzy Path - RCS
Dec 4, 2014
In previous blogs we described an approach to find a path that minimizes detection of a platform's emitters using Fuzzy Logic. In this entry we demonstrate an algorithm that uses a platform's radar cross section (RCS) to find a path that reduces its radar return. This approach uses the min-max composite relationship used in the passive sensor case, but replaces sensor detection criteria with progagation loss and platform RCS levels.
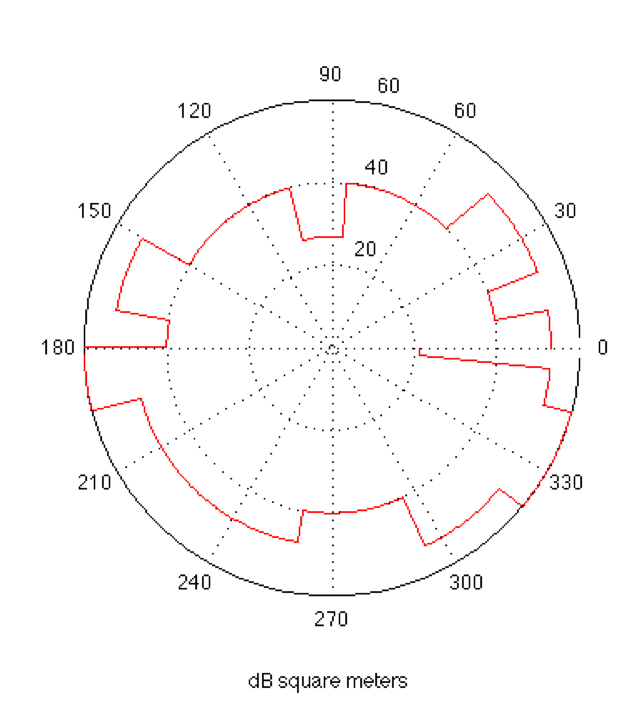
We use free space loss to calculate the propagation loss value for an 800 MHz emitter. The RCS value is constructed from a notional platform as shown in the figure to the right. In this diagram the front of the platform is pointing to the right (0°) with values that range from 20 to 60 dBsm (square meter). The RCS is asymmetric with the larger values on the right (starboard) side of the platform.
We use distance as one of the constraints for the same reasons as in the earlier blog: the diverted course might take the platform into a high-threat area, it might impact the defensive posture of the supported units or weather may be a factor. We adjust the membership values to establish the importance of the most direct path and to reduce the RCS (reducing the radar return) and choose the highest propagation path to further reduce the radar's received power.
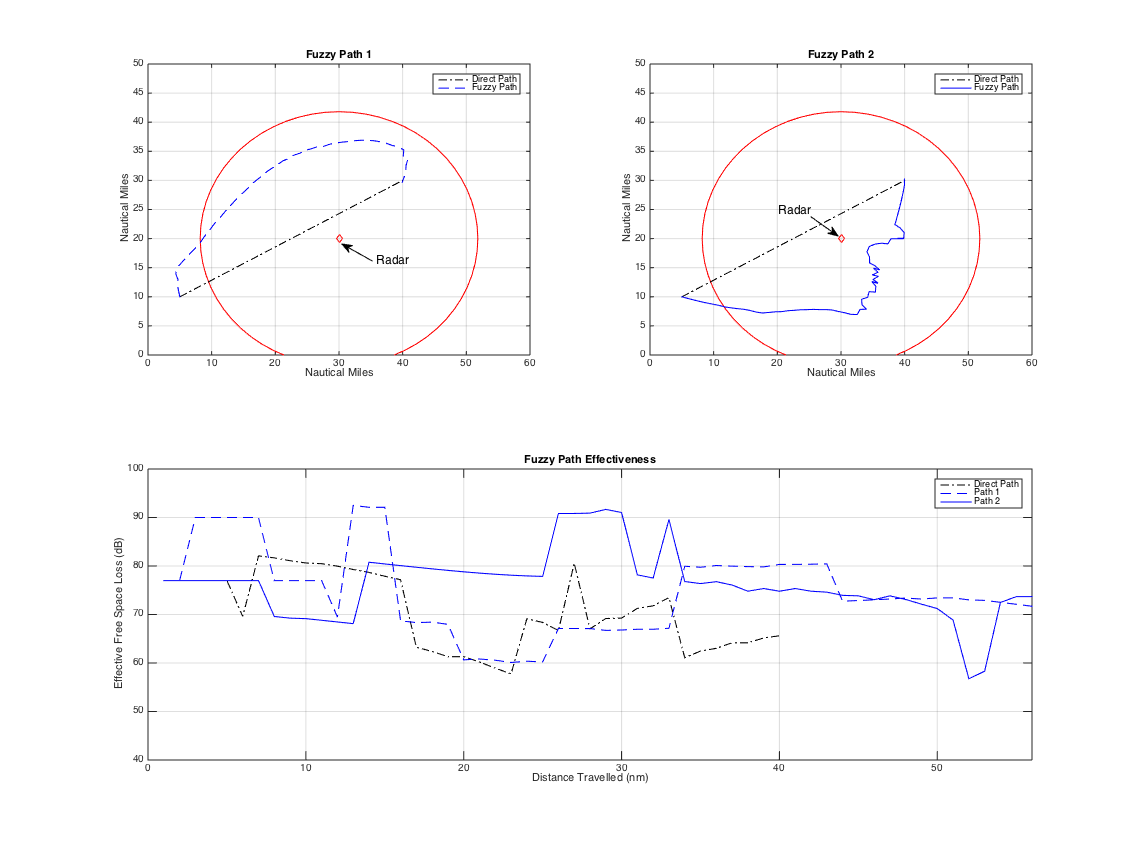
The "one-way" free space loss over the radar's line-of-sight (LOS) range is approximately 90 - 130 dB. The LOS range is depicted by the red circles in the two figures at the top of the page. We set the membership values to ramp up from 0 at 110 dB to 1 at 130 dB. Similarly we set the RCS membership values to ramp down over two different ranges between 20 and 60 dBsm.
The diagram above shows the fuzzy paths produced by two different settings for the RCS membership values. The first path set high values below 40 dB ramping down to low values above 60 dB. The second path's settings were 10 dB lower (30 and 50 dB) compared with Path 1.
The top left figure shows Path 1, which appears to tolerate the higher RCS values on the starboard side keeping the path to the north of the radar, while Path 2 (top right figure) forces the platform to the south, maintaining its lower RCS values directed to the radar. The bottom graph in this figure shows the effective propagation loss (Free Space Loss - RCS) over Path 1 and 2 along with the direct path's values. Paths 1 and 2 generally have an increased effective propagation loss compared with the direct path.
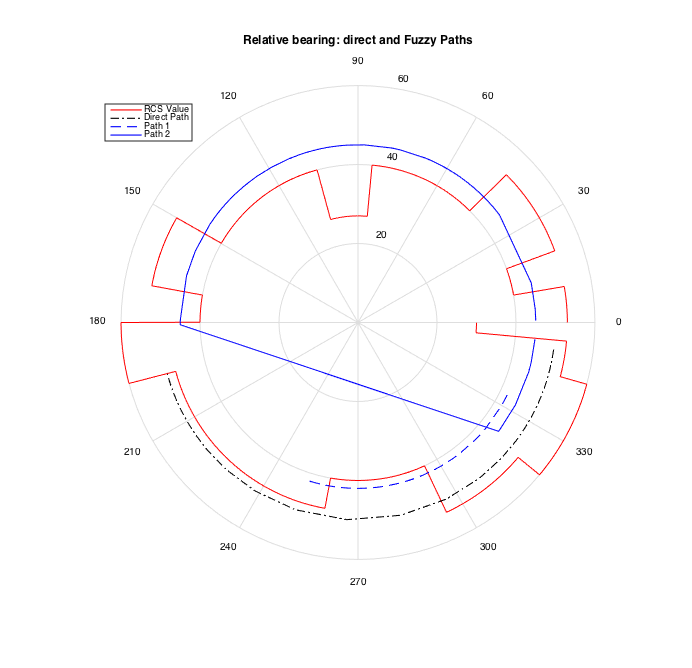
The diagram to the left shows the relative bearings against the RCS values. Path 1 covers a relatively narrow range of values on the starboard side compared to the direct path and it includes the region of the lowest RCS value. Path 2 covers a much broader range of values on the port side that are generally lower than the starboard side. This reduced set of values mitigate the lower propagation loss with this path's closer approach to the radar.