LOB Error Method Comparison
Aug 21, 2014
We compare our implementation of the Discrete Probability Density (DPD) method [Poisel] with two maximum likelihood estimation (MLE) methods. The DPD uses a von Mises probability density function (PDF) to model an angle-of-arrival sensor. The equation for the PDF over an angle (-π,π), is given by:
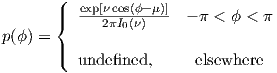
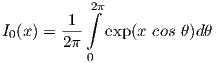
where ν is the inverse of the variance of ϕ around μ and I0(x) is the modified Bessel function of order 0:
|
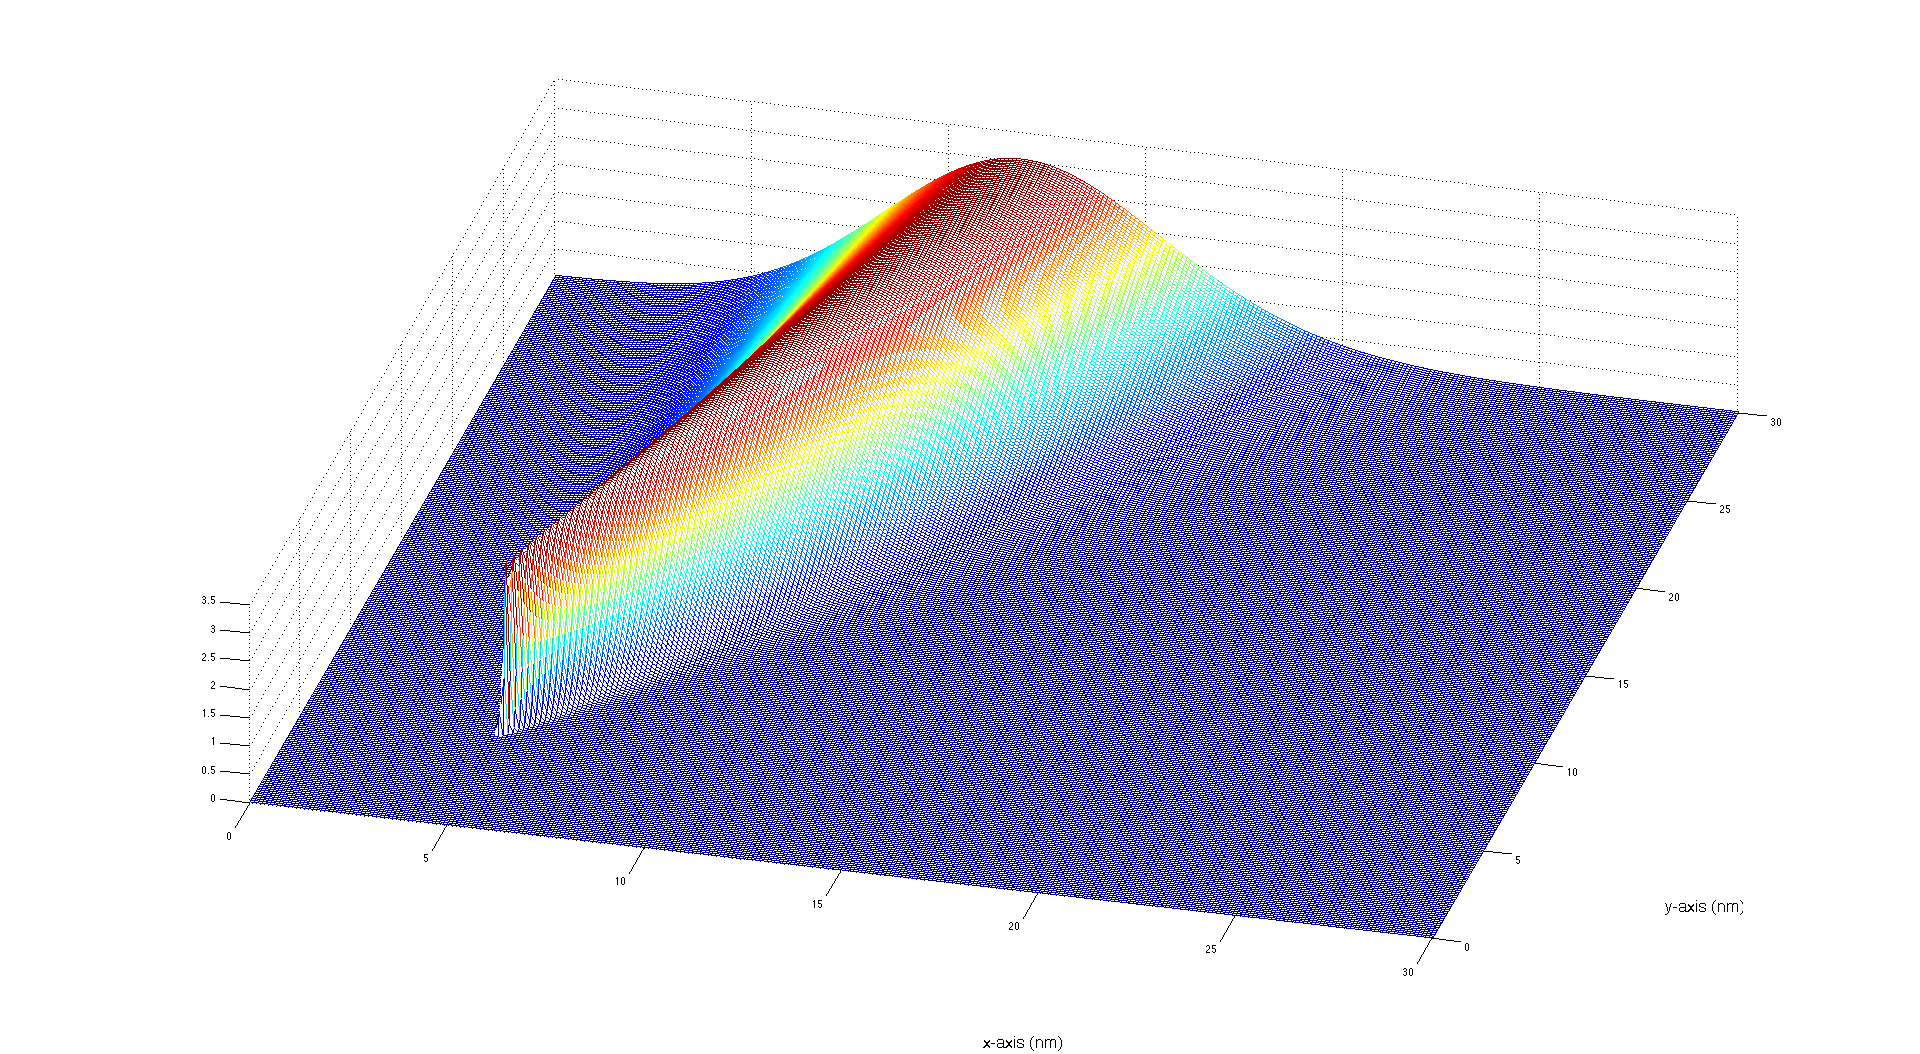
The PDF is a function of range and angle from the sensor. As the range increases the distribution spreads out and covers more of the region of interest. An example of which is shown in the figure to the right.
To find the error ellipse associated with a fix, and since we assume the sensors are independent, the combined probability is the product of the distributions from all the sensors. The geometry of the volume that contains the requisite probability ofcontainment (P c) is fit to an ellipse, which is projected on the surface. The product is:
![nF(x,y ) = ∏ exp-[vicos(ϕi --μi)] i=1 2πI0(νi)](../2014/DPD_Files/DPD_Compare2x.png)
|
Where n is the number of sensors
In our method we find the sum of the product over an increasing region until the appropriate value for Pc is obtained. The resulting error estimates are based on the resolution of the values for the contours used to numerically define the product.
The animation above compares the DPD method with a standard maximum likelihood estimate (MLE) [Zamora] and the Method of Stansfield (MoS) [Gething], which is a form of a MLE.
The diagram on the top left shows an emitter and its track as it passes by a three-sensor network. When the emitter is in line-of-sight range of the sensor the LOB with its variance is displayed along with the error ellipses and these ellipses are shown in the zoomed perspective display on the top right.
The bottom plot shows the error sizes, the Area of Uncertainty (AOU), in nm2 for each method throughout the emitter's track. As expected the MLE and MoS methods follow each other quite closely. The DPD method tracks with the other methods and the jumps at the contour breaks areclearly seen.
There is a high correlation between all three methods including ellipse size, shape and orientation. The DPD and MoS methods are most closely aligned when the emitter is passing near the sensor network. As the emitter moves away from the sensors, the DPD method shows the centerpoint of the error ellipse moving away from the target as the major axis of the ellipse increases in size.
References
Poisel, R.A., Electronic Warfare Target Location Methods, Artech House, 685 Canton Ct, Norwood, MA 02062, 2nd ed., 2012, pp. 75-78.
Pages-Zamora, A., Vidal, J, and Brooks, d., "Closed-form solution for positioning based on agnle of arrivel measurements," Personal, Indoor and Mobile radio Communications, 2002. The 13th IEEE International Symposium on, Vol. 4, Sept 2002, pp. 1522-1526 vol.4.
Gething, P., Radio direction-finding and the resolution of multicomponent wave-fields, P. Prengrinus on behalf of the Institution of Electrical Engineers, 1978, pp. 271-276.