MUOS Interference Model
June 9, 2014
With our partner, Princeton Satellite Systems, we developed ControlPlan under an SBIR for Navy PEO Space. The software was developed to demonstrate the ability to use mathematical optimization methods to support operational planners and to communicate their needs to resource planners. Typically these two groups are in different organizations and each has a complex set of constraints that drive their decisions.
ControlPlan was designed to perform two functions, to demonstrate the ability to create optimally configured plans for a highly constrained set of resources and to provide an output that could be used to effectively resolve planning issues between resource providers and tactical users.
To dynamically test ControlPlan we needed to develop a model that showed the impact of an external interferer on MUOS beam capacity. MUOS uses the third generation cellular protocol that uses code division multiple access (CDMA). CDMA allows users to share the same frequency band, but has a capacity limit, which is based on a number of factors including noise, adjacent channel interference and co-channel interferers. Interferers reduce the band's capacity within each beam based on the interferer's power, position and the position of the user terminal.
Since MUOS uses a CDMA 3G protocol we based its behavior on a terrestrial user capacity model described in [Garg]. We modified the model to allow for an external interferer that further reduces the capacity M.
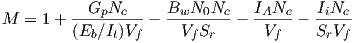 |
With the processing gain Gp, the spread spectrum bandwidth Bw, noise power spectral density N0, power control effectiveness Nc, the voice activity factor V f and the interferer power Ii. The value for Eb∕It was obtained using maximum user capacity provided by [Matassa] and using a notional value for IA.
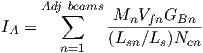
The adjacent beam interference (IA) is found using:
|
Where the associated values the adjacent beams (n), for gain GBn and for free space loss LSn were found using the relative angles and slant ranges.
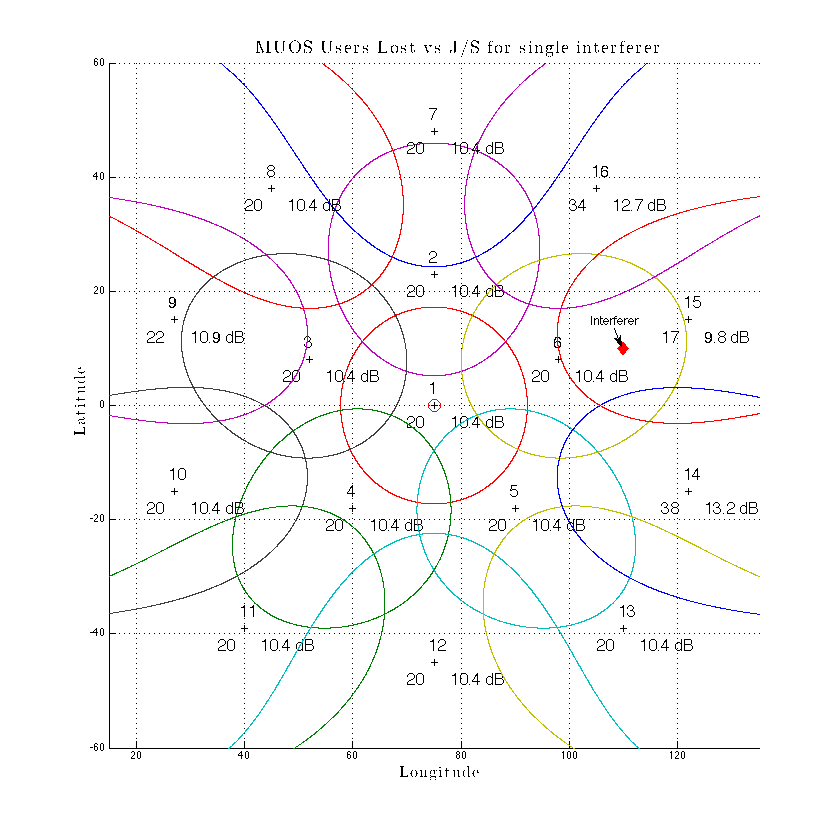
The figure shown above is an example of one scenario with an interferer at 10o N latitude and 110o E longitude. The reduction in user capacity is shown for each beam for a band that is co-channel with the interferer. The values show the loss of capacity and the interferer-to-signal ratio (in dB) in each beam.
This model allowed us to demonstrate ControlPlans optimization plans by producing a recommended User assignment that would ensure that demand did not exceed capacity and that geographically-dispersed users were able to reliably access the satellite until the interferer was disabled.
References
Garg, V.K., IS-95 CDMA and CDMA 2000: Cellular/PCS Systems Implementation, Prentice-Hall, Upper Saddle River, NJ, 2000.
Matassa, C.K., Comparing the Capabilities and Performance of the Ultra High Frequency Follow-on System with the Mobile User Objective System, Master's thesis, Naval Postgraduate School, Monterey, CA, June 2011.